DigitalTrendTradeAlerts | 0.3Digital Trend Trade Alerts is a compilation version of the Digital Trend Trade strategy that allows you to send out Trading View notifications:
The Digital Trend Trade trading strategy is designed for trading both local and global trends, as well as for displaying floating and fixed support levels and identifying price extremes.
The strategy consists of several main elements:
Global Average - On the chart, GA is displayed as the average price line, showing the current local trend direction with its color, as well as edging the bars to the trend color. Generates a signal when the local trend changes.
Global Trend - The second element of the strategy indicator is Global Trend, which forms the key support and resistance levels, when breaking through which the global trend changes and the corresponding signal is formed.
Bill Williams Fractal Levels - And the third element is the Bill Williams Fractal Levels block, which primarily fixes local extremes that can be used for scalping, as well as for setting a take profit and stop loss for a trade.
Support and resistance levels are also formed from local extremes.
To get access to the indicator, contact us via private messages.
ابحث في النصوص البرمجية عن "the strat"

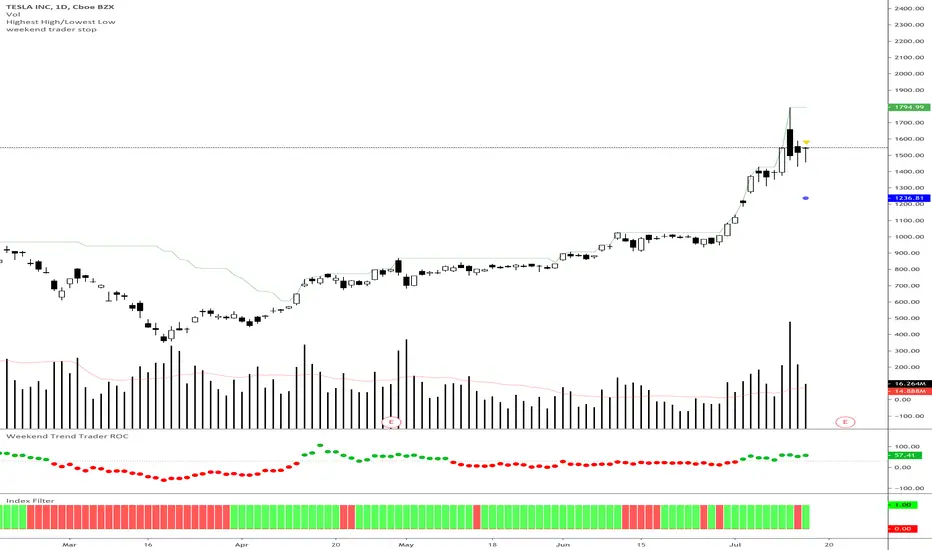
Weekend Trader Smoothed Rate of Change
Rate of change indicator based on Nick Radge's Weekend Trend Trader Strategy, with an added extra of EMA smoothing if you want it.
This indicator simply turns green when the rate of change is above a certain level (value is set in threshold)
Threshold is defaulted to 30 as outlined in the strategy rules
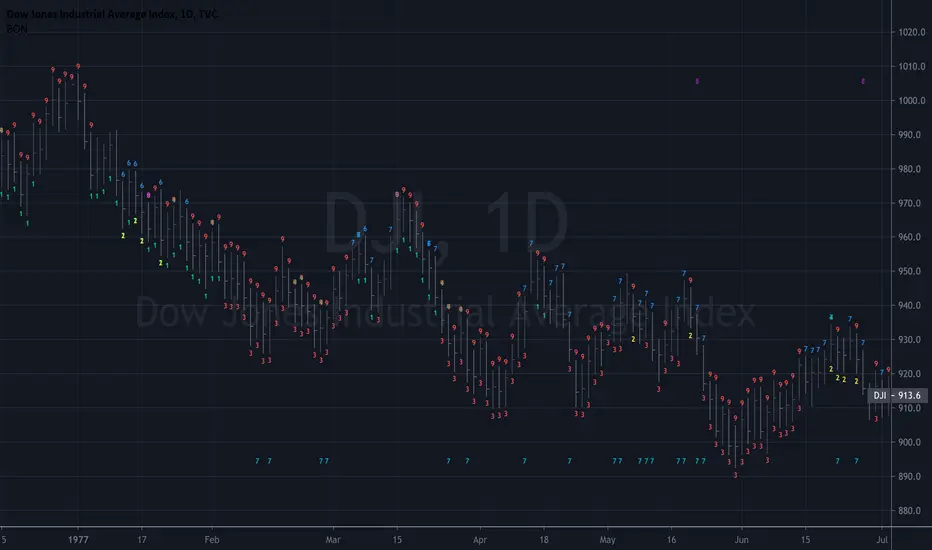
Bunch of NumbersBunch of numbers is part of a strategy project where conditions for trade entry and exit are evaluated
by numbers. I soon realized that the strategy I imagined is too complex and tedious for humans but would be perfect for a machine learning algorithm. For now, this indicator is what the name implies; just a bunch of numbers that may or may not be useful to the average trader.
The numbering system is derived from the distance of a candle’s close to EMA 50, EMA 100, and EMA 200.
I have yet to study all the different number sequences. I do know, however, that during strong bear or bull rallies, single 9’s and single 7’s will print consecutively until the rally ends.
The indicator has alerts for the number 8 and 6. 8 and 6 are usually found before a rally and at the end of a rally.
Yet another pattern I have identified is the string of 7’s as price approaches the 200MA. These 7’s will be at the bottom of the chart and can result in powerful breakouts or breakdowns.
There will be candles with multiple number assignments. I do not know what they imply. I've been coding for a month. Enjoy.
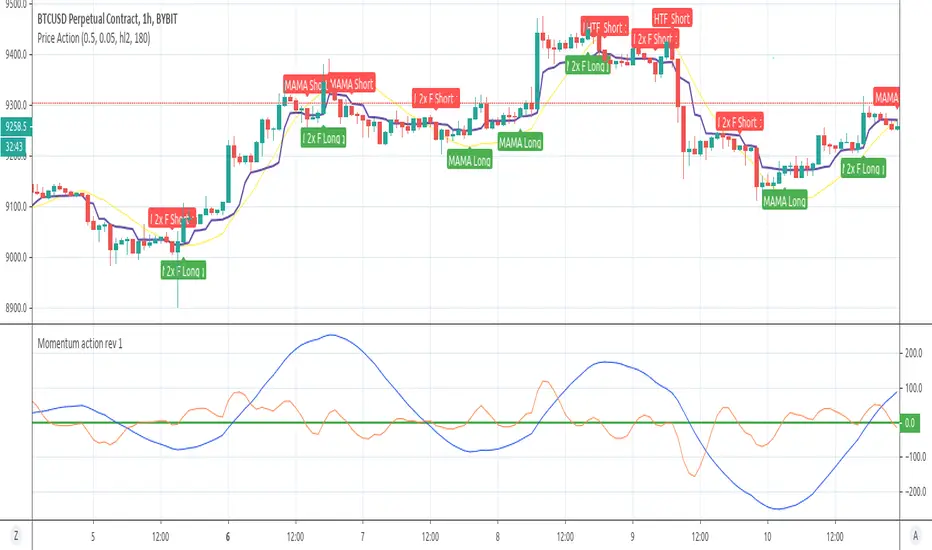
Advance strategy for trading and scalping for Crypto / Forex Hello traders ,
here i am introducing my strategy with updated features.
It provide signals for entering in the market and signal for exit.
Signal for opening short / sale position is when Price drop bellow the yellow line of the Indicator ( Price action ) and same time the red line of the Indicator Momentum Action is dropping .
Additional confirmation is if the price goes bellow MAMA line as well ( Violet colour on the chart )
For open buy/long position we need to see break over the Price action indicator ( Yellow line ) and same time the red line of Momentum indicator must goes over 0 level of the bottom chart.
The rule currently use 2 bars difference from break of price indicator or break of momentum level 0 , so the indicator will show long/short if the break of both points is within 2 bars .
I can suggest entering on H1 or H3/H4 time frames as on lower frames more noise .
I have added few more filters for more clear signals and higher win rate .
Added are MAMA ( The Mesa Adapter Moving Average by John Ehlers ) and FAMA ( Following Adaptive Moving Average )
Additional filter for monitoring Higher Time Frame Time frame position of the Momentum indicator .
For Example if we are watching basically at H1 time frame we can set HTF Filter Period to monitor 4 hours time frame and once we have same direction signals we will have confirmation . ( Moving Action indicator is same way in H1 and H4 ) .
Alerts can be set once signal appear you can be notified accordingly so you dont miss any trades
As before strongly suggest using Momentum Action Indicator on the chart .
Free trial period 15 days is available for all users who want to try the strategy , please contact me via personal message if you want to receive a trial period or for more information.
Thank you.
Test Me study versionthis is the study version of the strategy seen here
for detail explanation on it just visit the strategy,
it include alerts as well
As the name imply this is test version only
This indicator may repaint so I would advice to use it on real money only after you make sure it safe and not repainting
so i need your feedback in oreder to see what mistakes its doing in order to improve it
its experimental model so be ware on this issue if you use it

HFT The Ultimate Trend IndicatorThis is a trend following based strategy developed by HFT Research.
It works on Stocks, Forex and Cryptocurrency markets
This indicator comes fine tuned out of the box. It works on best on 15min, 1 hour and 4 hour time frames. It provides 3 separate entries for each of the time frames, providing you 12 different entry options.
Each time frame has the following options to choose from
You can use 1 hour settings on 15min chart however, it may not work the best.
Moderate entry will give you the modest amount of trades with modest amount of risk
Aggressive entry will give you wild entries and lots of action, if you are willing to babysit the trades, it might be an option for you
Conservative entry are best for those who want to automate the strategy or for those that don't have the time to trade the alerts actively

Trend-following Alert E v2.7 4HHi All,
Welcome to my third published Trend-following strategy for bitcoin, designed specifically for BITMEX:XBTUSD on 4H
This is an improvement of my second script (v2.6) to try and reduce 'chop' in consolidating ranges.
This script is the Alert script to use for settings up Alerts on Tradingview.
The accompanying strategy script and explanations/caveats you can find here:
In this script you will find the "active_long" and "active_long" variables (red and blue lines) that show which positions are being taken by the strategy script.
You can set 'Once per bar close' alerts for this to get your alerts on TV.
For instance, I use 'crossing up @ 0.1' on "active_long" to set an 'Open Long" alert and a 'crossing down @ 0.9' to set a 'Close Long' alert.
The same holds for the 'Open Short' and the 'Close Short' alerts but then for the 'active_short' variable.
I've also added start and end dates to test specific time periods.
Please let me know if you have any questions.

HFT Scalper IndicatorThis strategy is a scalper strategy developed by HFT Research. Scalper is highly customizable and provides endless opportunities to find profitable setups in the market.
Use Bollinger Bands
This piece of the settings will turn and off Bollinger band’s input in the decision making. BB Length will determine the Moving average you are using to take the standard deviation off of which is named as BB Multiplier. Default settings will use 20 moving average and take standard deviation of 2 to create lower and upper bands. Increasing the Multiplier will give you fewer but safer entries.
Use Bollinger Bands %
This setting will allow the user to determine at what Bollinger band width %, he wants to take start looking to take trades. It is known that when prices are stable and moving sideways, Bollinger bands contract and it becomes more reactive to small moves in the market. Using this setting, you can ignore the signals that would be generated while Bollinger bands are contracted. This setting will allow the user to weed out the noise in the market and really allow them to make the most out of Bollinger bands.
Use RSI
You can also turn on and off the RSI as well. Alternatively, there is an option to use RSI on a different time frame than you are currently on. For example, if you are looking at the 5min chart to use Bollinger bands but you would like to look at the RSI value on the 15min chart. You can do so by selecting the custom RSI timeframe as well as adjusting the Oversold and Overbought value.
Use STOCH
For those who want extra protection on their entry can throw STOCH into their decision making. STOCH acts like RSI but it is more prone to small moves. It will help the users to get a better entry if used correctly. Stoch may not be in the buy zone when RSI is at say 35, however, if price dips a little more and STOCH might be in the buy zone when RSI is at say 20. This way it will help you have better entries than just using RSI. In a way, you can use STOCH to scalp RSI.
Use VWAP
VWAP stands for volume weighted average price. It is an extremely useful indicator when trading intra-day. It does reset every trading session which is at 00:00 UTC. Instead of looking at x number of candles and providing an average price, it will take into consideration volume that’s traded at a certain price and weigh it accordingly.
Use ADX
ADX stands for average directional index. It is an indicator that measures volatility in the market. Unfortunately, the worst market condition for this strategy is sideways market. ADX becomes a useful tool since it can detect trend. If the volatility is low and there is no real price movement, ADX will pick that up and will not let you get in trades during a sideways market. It will allow you to enter trades only when the market is trending.
Use MA Filters
Lookback: It is an option to look back x number of candles to validate the price crossing. If the market is choppy and the price keeps crossing up and down the moving average you have chosen, it will generate a lot of “noisy” signals. This option allows you to confirm the cross by selecting how many candles the price needs to stay above or below the moving average. Setting it 0 will turn it off.
MA Filter Type: There is a selection of moving averages that is available on TradingView currently. You can choose from 14 different moving average types to detect the trend as accurate as possible.
Filter Length: You can select the length of your moving average. Most commonly used length being 50,100 and 200.
Filter Type: This is our propriety smoothing method in order to make the moving averages lag less and influence the way they are calculated slightly. Type 1 being the normal calculation and type 2 being the secret sauce.
Reverse MA Filter: This option allows you to use the moving average in reverse. For example, the strategy will go long when the price is above the moving average. However, if you use the reserve MA Filter, you will go short when the price is above the moving average. This method works best in sideways market where price usually retraces back to the moving average. So in an anticipation of price reverting back to the moving average, it is a useful piece of option to use during sideway markets which is the worst market condition for scalper.
Please visit our website for more information

Quickie (Free) IndicatorQuickie is a free tradingview Indicator developed by HFT Research. It works in sideways and trending markets depending the way you set it as well as both on short time frame and long time frame. It comes with backtesting abilities on tradingview.
You can find the alerts to go long and short here, please check the backtester to fine tune your strategy.
Use Bollinger Bands
This piece of the settings will turn and off Bollinger band’s input in the decision making. BB Length will determine the Moving average you are using to take the standard deviation off of which is named as BB Multiplier. Default settings will use 20 moving average and take standard deviation of 2 to create lower and upper bands. Increasing the Multiplier will give you fewer but safer entries
Use RSI
You can also turn on and off the RSI as well. Alternatively, there is an option to use RSI on a different time frame than you are currently on. For example, if you are looking at the 5min chart to use Bollinger bands but you would like to look at the RSI value on the 15min chart. You can do so by selecting the custom RSI timeframe as well as adjusting the Oversold and Overbought value.
Use MA Filter
Lookback: The indicator has an option to look back x number of candles to validate the price crossing. If the market is choppy and the price keeps crossing up and down the moving average you have chosen, it will generate a lot of “noisy” signals. This option allows you to confirm the cross by selecting how many candles the price needs to stay above or below the moving average. Setting it 0 will turn it off.
MA Filter Type: There is a selection of moving averages that is available on TradingView currently. You can choose from 14 different moving average types to detect the trend as accurate as possible.
Filter Length: You can select the length of your moving average. Most commonly used length being 50,100 and 200.
Filter Type: This is our propriety smoothing method in order to make the moving averages lag less and influence the way they are calculated slightly. Type 1 being the normal calculation and type 2 being the secret sauce .
Reverse MA Filter: This option allows you to use the moving average in reverse. For example, the strategy will go long when the price is above the moving average. However, if you use the reserve MA Filter, you will go short when the price is above the moving average. This method works best in sideways market where price usually retraces back to the moving average. So, in an anticipation of price reverting back to the moving average, it is a useful piece of option to use during sideway markets.
For more information please check out our website
Crypto Trend Following StudyThis is the study script indicator of Crypto Trend Following Strategy which can be used to automate your trading by alerts. With study script indicator, strategy can be easily automated.
To get access to the study script indicator please contact me directly by personal message.
To back test the strategy, see Crypto Trend Following Strategy indicator.
Script is using several moving averages to keep you on the right side of the trend. Signals are also filtered based on other indicators to prevent buying already overbought or selling already oversold coins and avoid ranging markets.
MAIN GOAL
Main goal of the strategy is long-term stable profit. No strategy has 100% accuracy therefore there always will be some false signals. But patience pays, with Trend Following Strategy, you will get couple of small loses while waiting to get big wins when coin is trending strongly. As you never know the right time you must sustain and be in all trades to make sure that you will not miss the big move.
BACKTEST
This script is for free to play with so you can back test and see for yourself how the strategy performs on any of your favourite coins.
Strategy is optimized and back tested for USDT and BTC pairs on 6h timeframe but it can be used on any pair and any timeframe.
RISK & REWARD
Strategy does not use safety orders as DCAs usually leads to bag holding sooner or later. It does not use take profit either as strategy will tell you when to buy and when to sell based on the actual market condition.
You should always use stop loss to protect your account from drawdown or even being liquidated.
You can change stop loss or take profit as you like or even back test the strategy with your preferred settings to find what suits you best.
STUDY SETTINGS
Important: Make sure that you use the same settings for both Strategy and Study indicators.
If you need any help with settings do not hesitate to ask. I would also appreciate any feedback and ideas how to improve the script.
==== Indicators settings ====
RSI Long < and StochRSI Long <
• used to filter out buy signals of already overbought coins - ( stoch ) RSI must be under set value to fire a BUY signal
RSI Short > and StochRSI Short >
• used to filter out sell signals of already oversold coins - ( stoch ) RSI must be over set value to fire a SELL signal
ADX >
• used to filter out buy or sell signals in ranging markets - ADX must be over set value to fire a BUY or SELL signal
MA Fast and Slow Length
• Two moving averages to indicate an actual short-term trend
Baseline Length & Type
• Baseline is a moving average which confirms the longer-term trend. You can set length and type of the moving average
Show every signal
• turn on to see signal on each candle whether strategy recommends opening long or short trade (green triangle – buy, red triangle – sell, no triangle – wait)

CME's BRL/USD to B3's USD/BRL ConversionThis indicator is made to calculate and show the spread between the currency pair USD-BRL being negotiatied in Brasil's B3 and in USA's CME Globex.
The orange line "Arbitrage" is the spread.
The red/green line is the "Stop Loss" recommended for the strategy. If the line is green, it means that the reward/tisk ratio is above 1.
IMPORTANT: MAKE SURE TO BE USING THE SAME TIMEFRAME ON BOTH THE INDICATOR AND THE CHART.

PROFIT+ V3 ALERTThis is an alert indicator for PROFIT+ V3 strategy .
Add it to your chart with the strategy and create alerts to
receive notifications when Buy and Sell signals are generated.
To receive access for the strategy and this indicator, please pm me or contact
me at telegram from the link below.
----------------------------------------------------------------------------
Это алерт индикатор к стратегии PROFIT+ V3 .
Используйте индикатор со стратегией и создавайте алерты
для получения уведомлений когда генерируются сигналы
на покупку и продажу.
Для получения доступа к стратегии и к данному индикатору,
пожалуйста, напишите мне в лс или в телеграм через ссылку ниже.

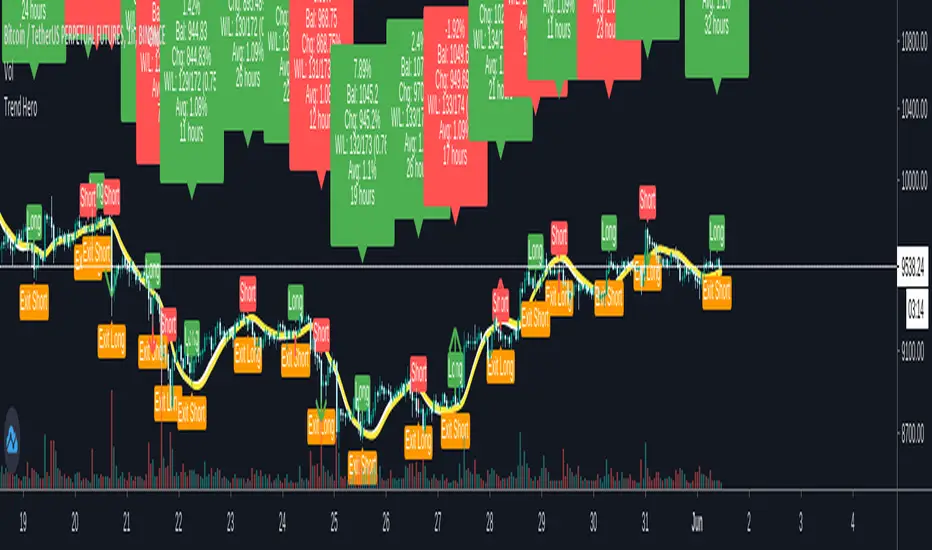
Trend HeroThis script is a strategy based on two Hull Moving averages that cross each other. Upon each cross, the strategy will take a long or a short position. If the faster Hull Moving Average crosses above the slower, a long position is opened. When it crosses towards the other direction, the long position is closed, and a short position is opened.
This backtest is based on results using 2x leverage.
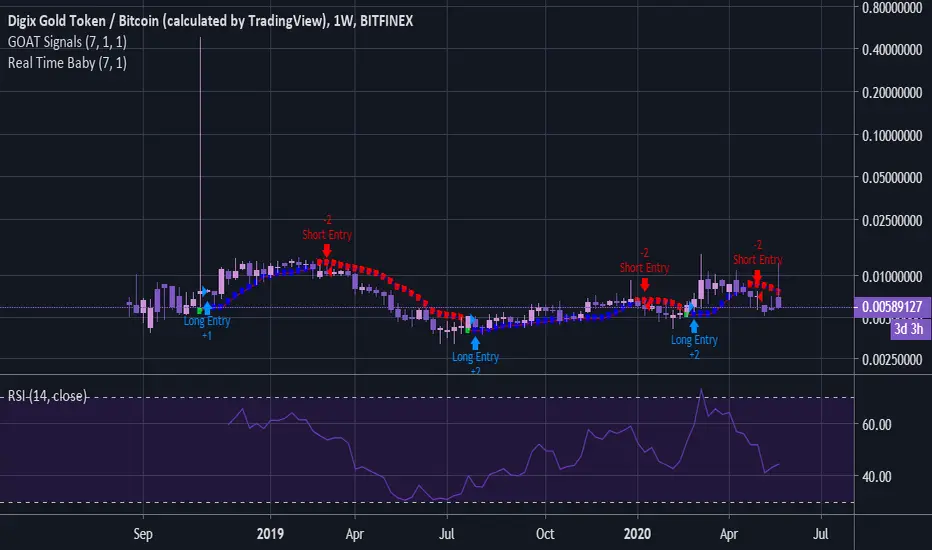
GOAT Signals - Real Time Baby! Custom Alert ScriptWELCOME to GOAT Signals - Real Time Baby! Custom No Repaint Buy Sell Moving Average (MA) Alert Script!
This script can be set to send GOAT Signals Custom Indicator Alerts.
The Step input gives price action some breathing space if desired. Steps can be added or subtracted.
The strategy tester does not calculate in trading fees, therefore in most cases will work better on longer time frames.
Personally, I use the Daily and Weekly charts except during high volatility , and use a one or two bar trail depending on price action.
Past performance does NOT guarantee future gains but keep in mind Bitcoin , Litecoin and a few others are on deflationary cycles.
Access included with GOAT Signals Custom No Repaint Buy Sell Arrow Strategy Tester.
For full invite only access please contact DogeyBlaze.
Not Certified Financial Advice.
Arbitrage DOL BR / DOL USAThis indicator is made to calculate and show the spread between the currency pair USD-BRL being negotiatied in Brasil's B3 and in USA's CME Globex.
The orange line "Arbitrage" is the spread.
The red/green line is the "Stop Loss" recommended for the strategy. If the line is green, it means that the reward/tisk ratio is above 1.
IMPORTANT: MAKE SURE TO BE USING THE SAME TIMEFRAME ON BOTH THE INDICATOR AND THE CHART.

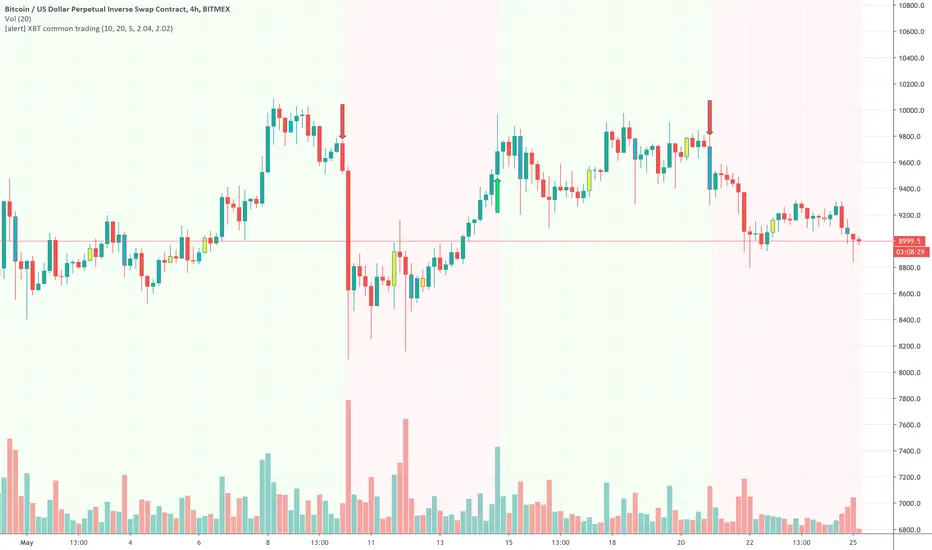
[alert] XBT common trading* This indicator is paired with the strategy indicator ' XBT common trading'
Trend following strategy for XBTUSD .
Optimized for XBTUSD 4H chart
* backtesting results do not guarantee future results.
If you want to use this strategy, contact me with my profile information below.
[Alert] XBT Swing Trade Strategy* This indicator is paired with the strategy indicator ' XBT Swing Trade Strategy'
This is swing trade strategy for XBT trading.
Optimized for XBTUSD 4H.
I have developed about 20 years on IT field, and got several years of quant experience.
This indicator is never be repainted like other fake indicators.
A 2-day trial period is provided. (for testing the strategy with replay)
The default setting is recommended, but it is also possible to optimize it by setting the details of the three category settings.
(Trade points of settings A, B factors are displayed in the transaction history to help tuning)
And supports limiting backtesting period for detailed backtesting.
* Note: Backtesting results do not guarantee future results.
This indicator is an invite only indicator.
If you want to use this indicator, contact with my information below.

Daily Moving Averages on Intraday ChartsPrints exponential 8, 21, 50, 100 and 200-day moving averages on intraday charts. For example, if you are on a 5 minute chart, you will see a magenta "X" making the current value of the 8-day EMA with an "8" label above it.
This is NOT a Strat script and it follows more closely the way Scott Redler from T3Live looks at charts. If you acknowledge that the vast majority of the time, price does have some sort of reaction to these daily EMAs (whether just a short relative pause or the beginning of a reversal), this script may be helpful.
The Strat and Rob Smith DO NOT support the use of moving averages. This adds more data to your chart which you may or may not find extraneous.

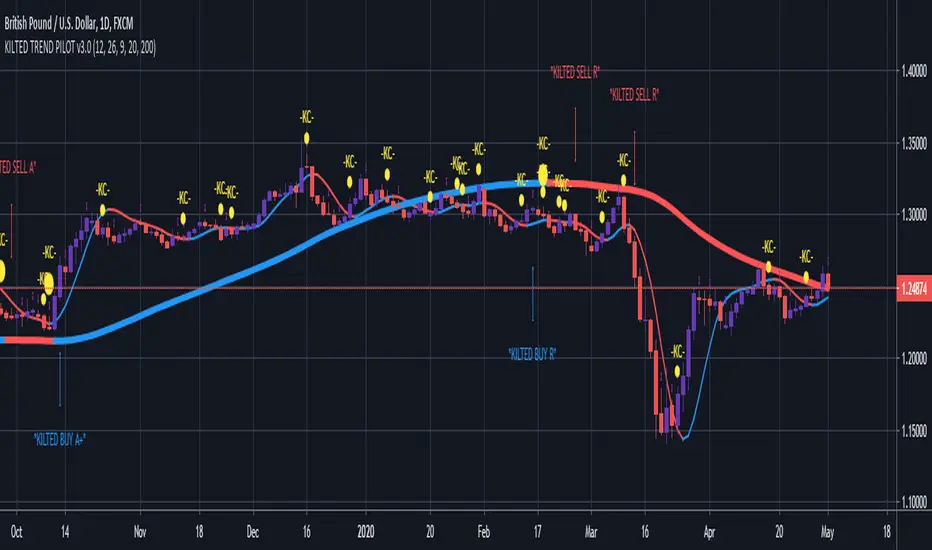
KILTED TREND PILOTDescription: Uses the Hull Moving Average ( HMA ) and MACD to observe the following strategy, to assist with trade setups and provide confluence. It is especially effective when used with the Kilted Strength Meter to make sure there is an active trend and the market is not moving sideways.
SETTINGS AND EXPLANATION
1. The strategy is a very simple and visual one where you go:
• Long when the short HMA colour matches the long HMA colour (which is when the 2 colours are blue for a long position).
• Short when the short HMA colour matches the long HMA colour (which is when the 2 colours are red for a short position)
2. Ideally you want to enter a trade when the market is trending and not moving sideways, hence the reason the Kilted Strength Meter makes a great companion to complement this strategy
Trend-following Alert E v2.6 4H ETHBTCHi All,
Welcome to my first published Trend-following strategy for Ethereum, designed specifically for POLONIEX:ETHBTC on 4H due its long price history.
This script is based on my previously published scripts for bitcoin.
This script is the Alert script to use for settings up Alerts on Tradingview.
The accompanying strategy script and explanations/caveats you can find here:
In this script you will find the "active_long" and "active_long" variables (red and blue lines) that show which positions are being taken by the strategy script.
You can set 'Once per bar close' alerts for this to get your alerts on TV.
For instance, I use 'crossing up @ 0.1' on "active_long" to set an 'Open Long" alert and a 'crossing down @ 0.9' to set a 'Close Long' alert.
The same holds for the 'Open Short' and the 'Close Short' alerts but then for the 'active_short' variable.
I've also added start and end dates to test specific time periods.
Please let me know if you have any questions.

MA-EMA Crossover AlertsThis is a script for getting alerts for the MA-EMA XO Strategy that I published recently.
This is probably the first version that I am putting out for this logic.
Based on feedback (and some coding suggestions and support if anyone is willing), I will try to improve this further.
So, what do we have in this script -
I have created 5 alert conditions. The 4 alerts are straight-forward : Entry / Exit alerts for Long / Short.
The fifth alert is just a single Alert which is triggered if any of the 4 alert conditions are met. Then user can check the chart to see what trade is triggered.
I am not explaining the logic of the indicator here since it is kind-of covered in the strategy.

Breakout Machine V2 - Alerts - Bitcoin BeatsHello, Hello, Hello and welcome back to Bitcoin Beats.
As the title suggests, this is Version 2 of The Breakout Machine Alerts version.
Unlike the previous version, this one has been fine-tuned to work best on Binance Futures ( BTCUSDT ).
PLEASE BE CAREFUL WITH YOUR LEVERAGE AND DON'T GET REKT.
Trade at your own risk! Good luck!
This strategy takes MACD and Volume spikes to calculate pumps and dumps in the bitcoin market.
I've also added custom backtesting inputs and leverage for you all to experiment with and see the profitability of the Strategy.
Alerts version coming soon...
Thank you, And goodbye, from Bitcoin Beats.

Crypto Scalper Pro Study / Alerts===========
Crypto Scalper Pro Study Script with Alerts
===========
Our Crypto Scalper Pro Study with Alerts Script is a carbon copy of our tried and tested Crypto Scalper Pro Strategy , but now with the option of setting TradingView Alerts for your chosen trading plan. Making missing trades a thing of the past, and helping you to automate your own trading strategy using AutoView, 3Commas or similar 3rd party Auto Trading Software.
-----------
Crypto Scalper Pro is a scalping strategy developed to work alongside our Crypto Tipster Strategy, now you can trade the D markets with our Tipster, and Intra-Day markets with our Scalper!
This strategy works very well on shorter time frames across multiple crypto pairs, everything from 4H all the way down to a 5m chart, our Crypto Scalper will find the best Entry and Exit points for consistent and reliable returns.
We've added a few variables for you to play with to fine tune this scalper to suit your chosen trading plan - however, these will only adjust the strategy to a certain degree, as there are many algorithms and indicators doing their thing hidden in the background that take precedence.
-----------
What's Included?
Crypto Scalper Pro comes with a host of features and is being continually updated, these features include (but are not limited to):
- Date Range Settings
Setting custom Start/End dates can help hone your strategy to suit the current times, or get a general overview of the market over the years.
- Heikin Ashi Confirmation
We added HA confirmation for both Entry & Exit of trades. This started as a form of "Safe Mode", we have since adapted our safe mode far beyond Heikin Ashi; but kept this confirmation as an added extra.
- Variable Indicator Settings
As well as our Fixed Indicators and Price Action analysis going on in the background of the strategy, we've also included some Variable Indicators that you have access to edit.
Lookback Period will help establish how far back you'd want to be confirming price indications on the strategy - the higher the number the further back it will look, making the Scalping Strategy appear smoother with less trades during choppy times, the downside with a higher lookback is you might miss the start of a potentially epic trade, and only be shown an Entry after the event has already happened.
We find Lookback Lengths of between 5 and 100 could work depending on various other settings, the market being traded, and the timeframe being used.
MA Length (Length of Moving Average) - We use a few MA's to best determine various factors involved with successfully scalping a market, overall trend direction, current price movements and fake-out detection to name just a few. You've got the option of determining a good average length for a few of these variables.
Again, a short MA Length will catch every big move right at the start, but you're almost guaranteed a Negative Expected Value with that method, due to the vast quantity of losing trades in times of chop/ranging markets. A Higher MA Length will remove a lot of chop, reduce the quantity of trades, and therefore (should) result in a higher Percent of Trades Profitable; it will however add a certain lag to the strategy, meaning those highly profitable trades we're looking for may turn out to be not so highly profitable!
- Safe Mode
Enabling Safe Mode will add a couple more confirmation indicators to the strategy - the aim of Safe Mode is, in essence, to remove any trading signals that would end of being false/bad moves. Usually resulting in less Overall Trades, a higher Net Profit, higher % Profitable, higher Profit Factor AND a lower Drawdown. Use Safe Mode to help eliminate orders that would otherwise be placed in choppy markets.
- Stop Loss/Take Profit Settings
This is where Crypto Scalper Pro really proves itself, Money Management. We have an editable Fixed SL/TP, as well as Trailing Stops for Long or Short orders, all of which you can use on their own, or combined with each other. Playing with these settings can turn an un-profitable system into a very-profitable trading plan!
-----------
What's Included within Crypto Scalper Study / Alerts Script?
Our Study script will find Entry and Exit points exactly as our Pro Strategy would find them. The same indicators, methods and chart reading techniques are used, there are 2 big differences however...
The first difference is that our Pro Strategy has the ability to manage your money, Fixed Stops, Take Profit and Trailing Stops to name just a few. Our Study does not (yet) have these functions added due to the way TradingView's charting platform operates.
That's the bad news, the good news for our Crypto Scalper Study Script is that you can add Alerts to your trading plan! This is super handy if you decide to implement our methods into different time frames across various markets and are looking for Intra-day Alerts, or if you're looking to Automate your trading strategy using external software.
Help and Advice for setting up Alerts or to Automate your Strategy can be found on our website.
----------
For more information on the Crypto Scalper Pro Strategy visit the link in our signature.
Good Luck and Happy Trading!
